# 📡 Fleet Control Console
🌍 *[Read in English](#english) | 🇮🇹 [Leggi in Italiano](#italiano)*
---
## 🇬🇧 English
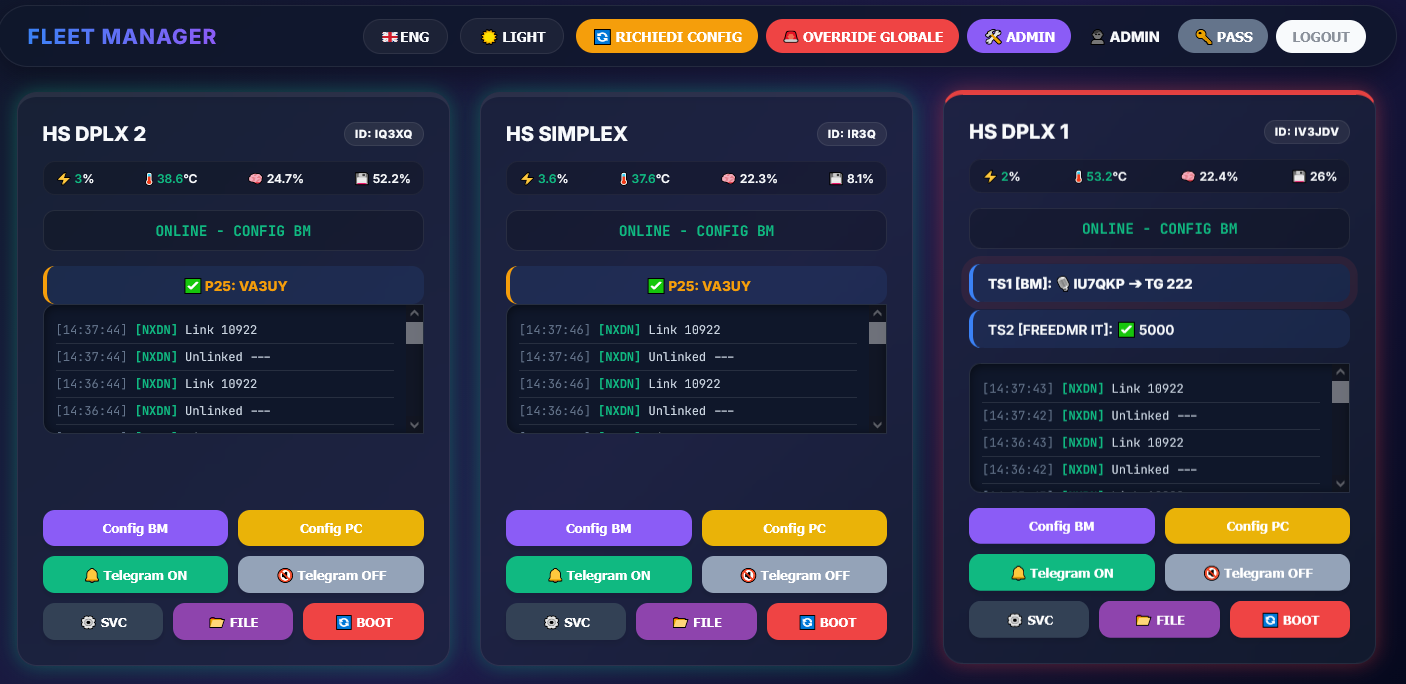
**Fleet Control Console** is a professional, real-time command and control (C2) dashboard designed for amateur radio repeater networks (MMDVM). It allows administrators to monitor and manage a "fleet" of remote digital voice nodes (DMR, NXDN, YSF, P25) through a single, elegant web interface.
### 🏗️ System Architecture
The ecosystem consists of three main parts:
1. **The Central Dashboard (`app.py`):** A Flask web server that handles the UI (with modern Glassmorphism design), user permissions (SQLite), and **WebSocket connections for zero-latency updates**.
2. **The Remote Agent (`system_monitor.py`):** A lightweight script running on each repeater (Raspberry Pi/Linux) that monitors hardware and executes commands.
3. **The MQTT Broker:** The communication backbone. All data and commands flow through MQTT for near-instant responsiveness.
### ✨ Features
* **Zero-Latency Real-Time UI:** Powered by WebSockets (Socket.IO), the dashboard updates instantly upon radio traffic or telemetry changes, completely eliminating heavy HTTP polling overhead.
* **Web Push Notifications:** Get instant alerts directly on your desktop or mobile device when a node goes offline, comes back online, or a critical service fails (even when the app is closed or in the background).
* **Centralized Telemetry:** Real-time CPU, RAM, Temperature, and Disk usage for all nodes.
* **Service Management:** Start, Stop, or Restart system daemons (MMDVMHost, DMRGateway, etc.) remotely.
* **Smart Auto-Healing:** The agent automatically detects crashed services and attempts to revive them before raising critical alerts (includes Telegram notifications).
* **Hardware Reset (GPIO):** Physically reboot the MMDVM radio HAT via GPIO pins directly from the dashboard, automatically restarting the host daemon for a fail-proof serial connection recovery.
* **Remote Configuration:** Built-in web editor for `.ini` files—no SSH required.
* **Live Heard Log:** Unified, real-time view of radio traffic across the entire network.
* **Global Operations:** Switch profiles (e.g., Profile A/B) or force network-wide configuration updates instantly on all repeaters with one click.
* **PWA Ready (Mobile App):** Fully responsive design that can be installed directly on Android/iOS as a Progressive Web App for a native, full-screen mobile experience.
### 🚀 Installation & Setup
#### 1. Server Setup (Central Hub)
* Install dependencies: `pip install flask flask-socketio paho-mqtt psutil werkzeug pywebpush`
* Configure `config.json` (use `config.example.json` as template) with your MQTT and WebPush VAPID credentials.
* Define your repeaters in `clients.json`.
* Run: `python3 app.py`
#### 2. Agent Setup (Remote Nodes)
The `system_monitor.py` must be installed on every node you wish to monitor.
* *(Optional)* Install `RPi.GPIO` (`pip install RPi.GPIO` or `apt install python3-rpi.gpio`) if you plan to use the physical Hardware Reset feature.
* Place `system_monitor.py` and `node_config.json` in a folder (e.g., `/opt/node_agent/`).
* Edit `node_config.json` to set the `client_id` (must match the ID in `clients.json`) and MQTT credentials.
* (Recommended) Set up a systemd service to run the agent automatically at boot.
---
## 🇮🇹 Italiano
**Fleet Control Console** è una dashboard di comando e controllo (C2) professionale in tempo reale, progettata per le reti di ripetitori radioamatoriali (MMDVM). Permette ai gestori di monitorare e gestire un'intera "flotta" di nodi digitali (DMR, NXDN, YSF, P25) da un'unica interfaccia web raffinata.

### 🏗️ Architettura del Sistema
L'ecosistema si compone di tre parti principali:
1. **Dashboard Centrale (`app.py`):** Un server web Flask che gestisce l'interfaccia (con design moderno in stile Glassmorphism), i permessi utenti (SQLite) e **connessioni WebSocket per aggiornamenti a latenza zero**.
2. **Agente Remoto (`system_monitor.py`):** Uno script leggero in esecuzione su ogni ripetitore (Raspberry Pi/Linux) che raccoglie i dati hardware ed esegue i comandi.
3. **Broker MQTT:** Il centro nevralgico della comunicazione. Tutti i dati e i comandi viaggiano su MQTT per una reattività istantanea.
### ✨ Funzionalità
* **Interfaccia Real-Time a Latenza Zero:** Grazie all'integrazione di WebSockets (Socket.IO), la dashboard scatta all'istante al passaggio di traffico radio o ai cambi di telemetria, eliminando totalmente il carico del polling HTTP continuo.
* **Notifiche Push Web:** Ricevi avvisi immediati su desktop o smartphone quando un nodo va offline, torna operativo o un servizio critico si blocca (anche quando l'app è chiusa o in background).
* **Telemetria Centralizzata:** Stato in tempo reale di CPU, RAM, Temperatura e Disco di tutti i nodi.
* **Gestione Servizi:** Avvio, arresto o riavvio dei demoni di sistema (MMDVMHost, DMRGateway, ecc.) da remoto.
* **Auto-Healing Intelligente:** L'agente rileva automaticamente i servizi andati in blocco e tenta di rianimarli prima di inviare allarmi critici (include notifiche Telegram).
* **Reset Hardware (GPIO):** Invia un impulso di reset fisico alla scheda radio MMDVM tramite i pin GPIO direttamente dalla dashboard, riavviando automaticamente il demone host per ripristinare la comunicazione seriale.
* **Configurazione Remota:** Editor web integrato per i file `.ini`: modifica i parametri senza accedere in SSH.
* **Log Ascolti Live:** Vista unificata e in tempo reale del traffico radio di tutta la rete.
* **Operazioni Globali:** Commuta tra diversi assetti (es. Profilo A/B) o forza l'aggiornamento dei dati contemporaneamente su tutta la rete con un solo clic.
* **PWA Ready (App Mobile):** Design completamente responsivo, installabile su smartphone Android e iOS come Progressive Web App per un'esperienza fluida e nativa a schermo intero.
### 🚀 Installazione e Configurazione
#### 1. Setup del Server (Hub Centrale)
* Installa le dipendenze: `pip install flask flask-socketio paho-mqtt psutil werkzeug pywebpush`
* Configura `config.json` (usa `config.example.json` come base) con le credenziali MQTT e le chiavi VAPID per le notifiche Push.
* Definisci i tuoi ripetitori nel file `clients.json`.
* Avvia: `python3 app.py`
#### 2. Setup dell'Agente (Nodi Remoti)
Il file `system_monitor.py` va installato su ogni nodo che vuoi monitorare.
* *(Opzionale)* Installa `RPi.GPIO` (`pip install RPi.GPIO` o `apt install python3-rpi.gpio`) se intendi utilizzare la funzione di Reset Hardware fisico della scheda.
* Copia `system_monitor.py` e `node_config.json` in una cartella (es. `/opt/node_agent/`).
* Modifica `node_config.json` impostando il `client_id` (deve corrispondere all'ID in `clients.json`) e le credenziali MQTT.
* (Consigliato) Crea un servizio systemd per avviare l'agente automaticamente al boot.
---
*Created by IV3JDV @ ARIFVG - 2026*